Human Movement Data Science? How do you apply data reduction…

Gathering a measurement is becoming easier. Applying logic to the measurement to understand application is much more challenging.

Data related to human movement can be complicated to review. When you have a direct measure of a knee joint flexion angle you might not know exactly what it means. Furthermore, that is one data point of thousands that are possible. How can you combine and reduce all of those data points into something that is more easily understood? That’s the challenge.
A good real world example of human movement data reduction analysis is baseball. If you watched an athlete play a game of baseball it’s hard to determine if they are “good” at the sport. Every swing, throw, or interaction may seem irrelevant. But, if you start to combine those swings you can start to understand more about that athlete. For example, you can reduce a lot of at bats to categories like; batting average or slugging percentage. That is data reduction.
For the knee flexion angle example mentioned earlier one of the first data analysis processes you might look at is comparing it to a normative range for a population. Based on the population range you will be able to know if the subject measured value is in or out of normative range. How those ranges are designed and set is part of the reduction method in data science which makes human movement review complicated. Lastly, when evaluation didn’t have planes of movement or different date sets it complicated to determine the value of each as you work to combine those data sets for review. If you overweight a variable you can mask or water down another. Making your reduction technique less valuable. The key is completing the balancing act of reducing your data for review, but not missing on the important decisions that need to be made.
Recent Posts

Insights In Motion – Interview Series

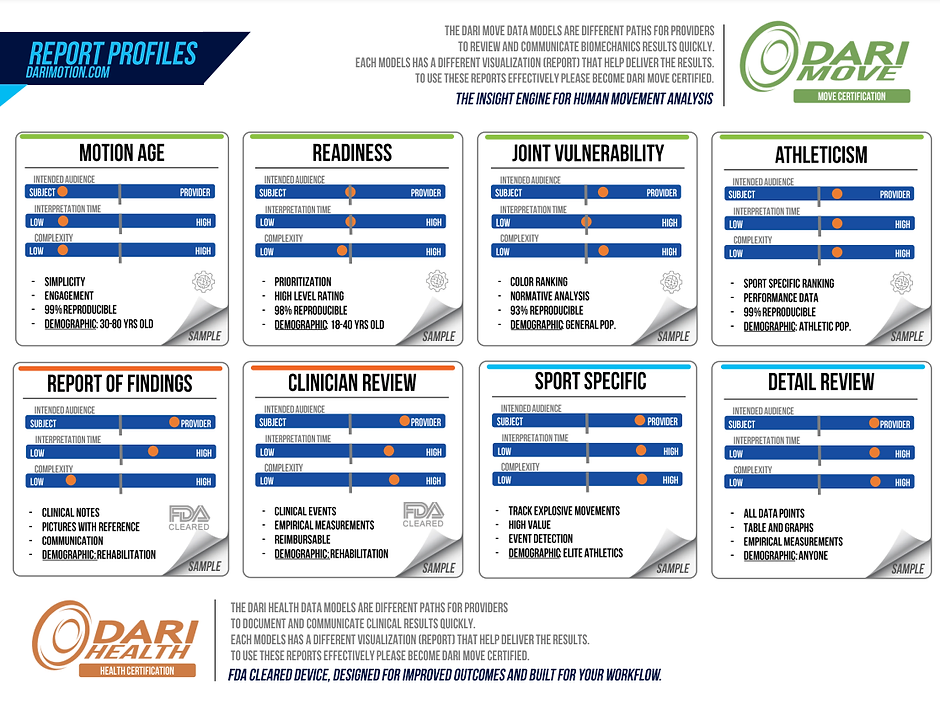
Report Profiles
